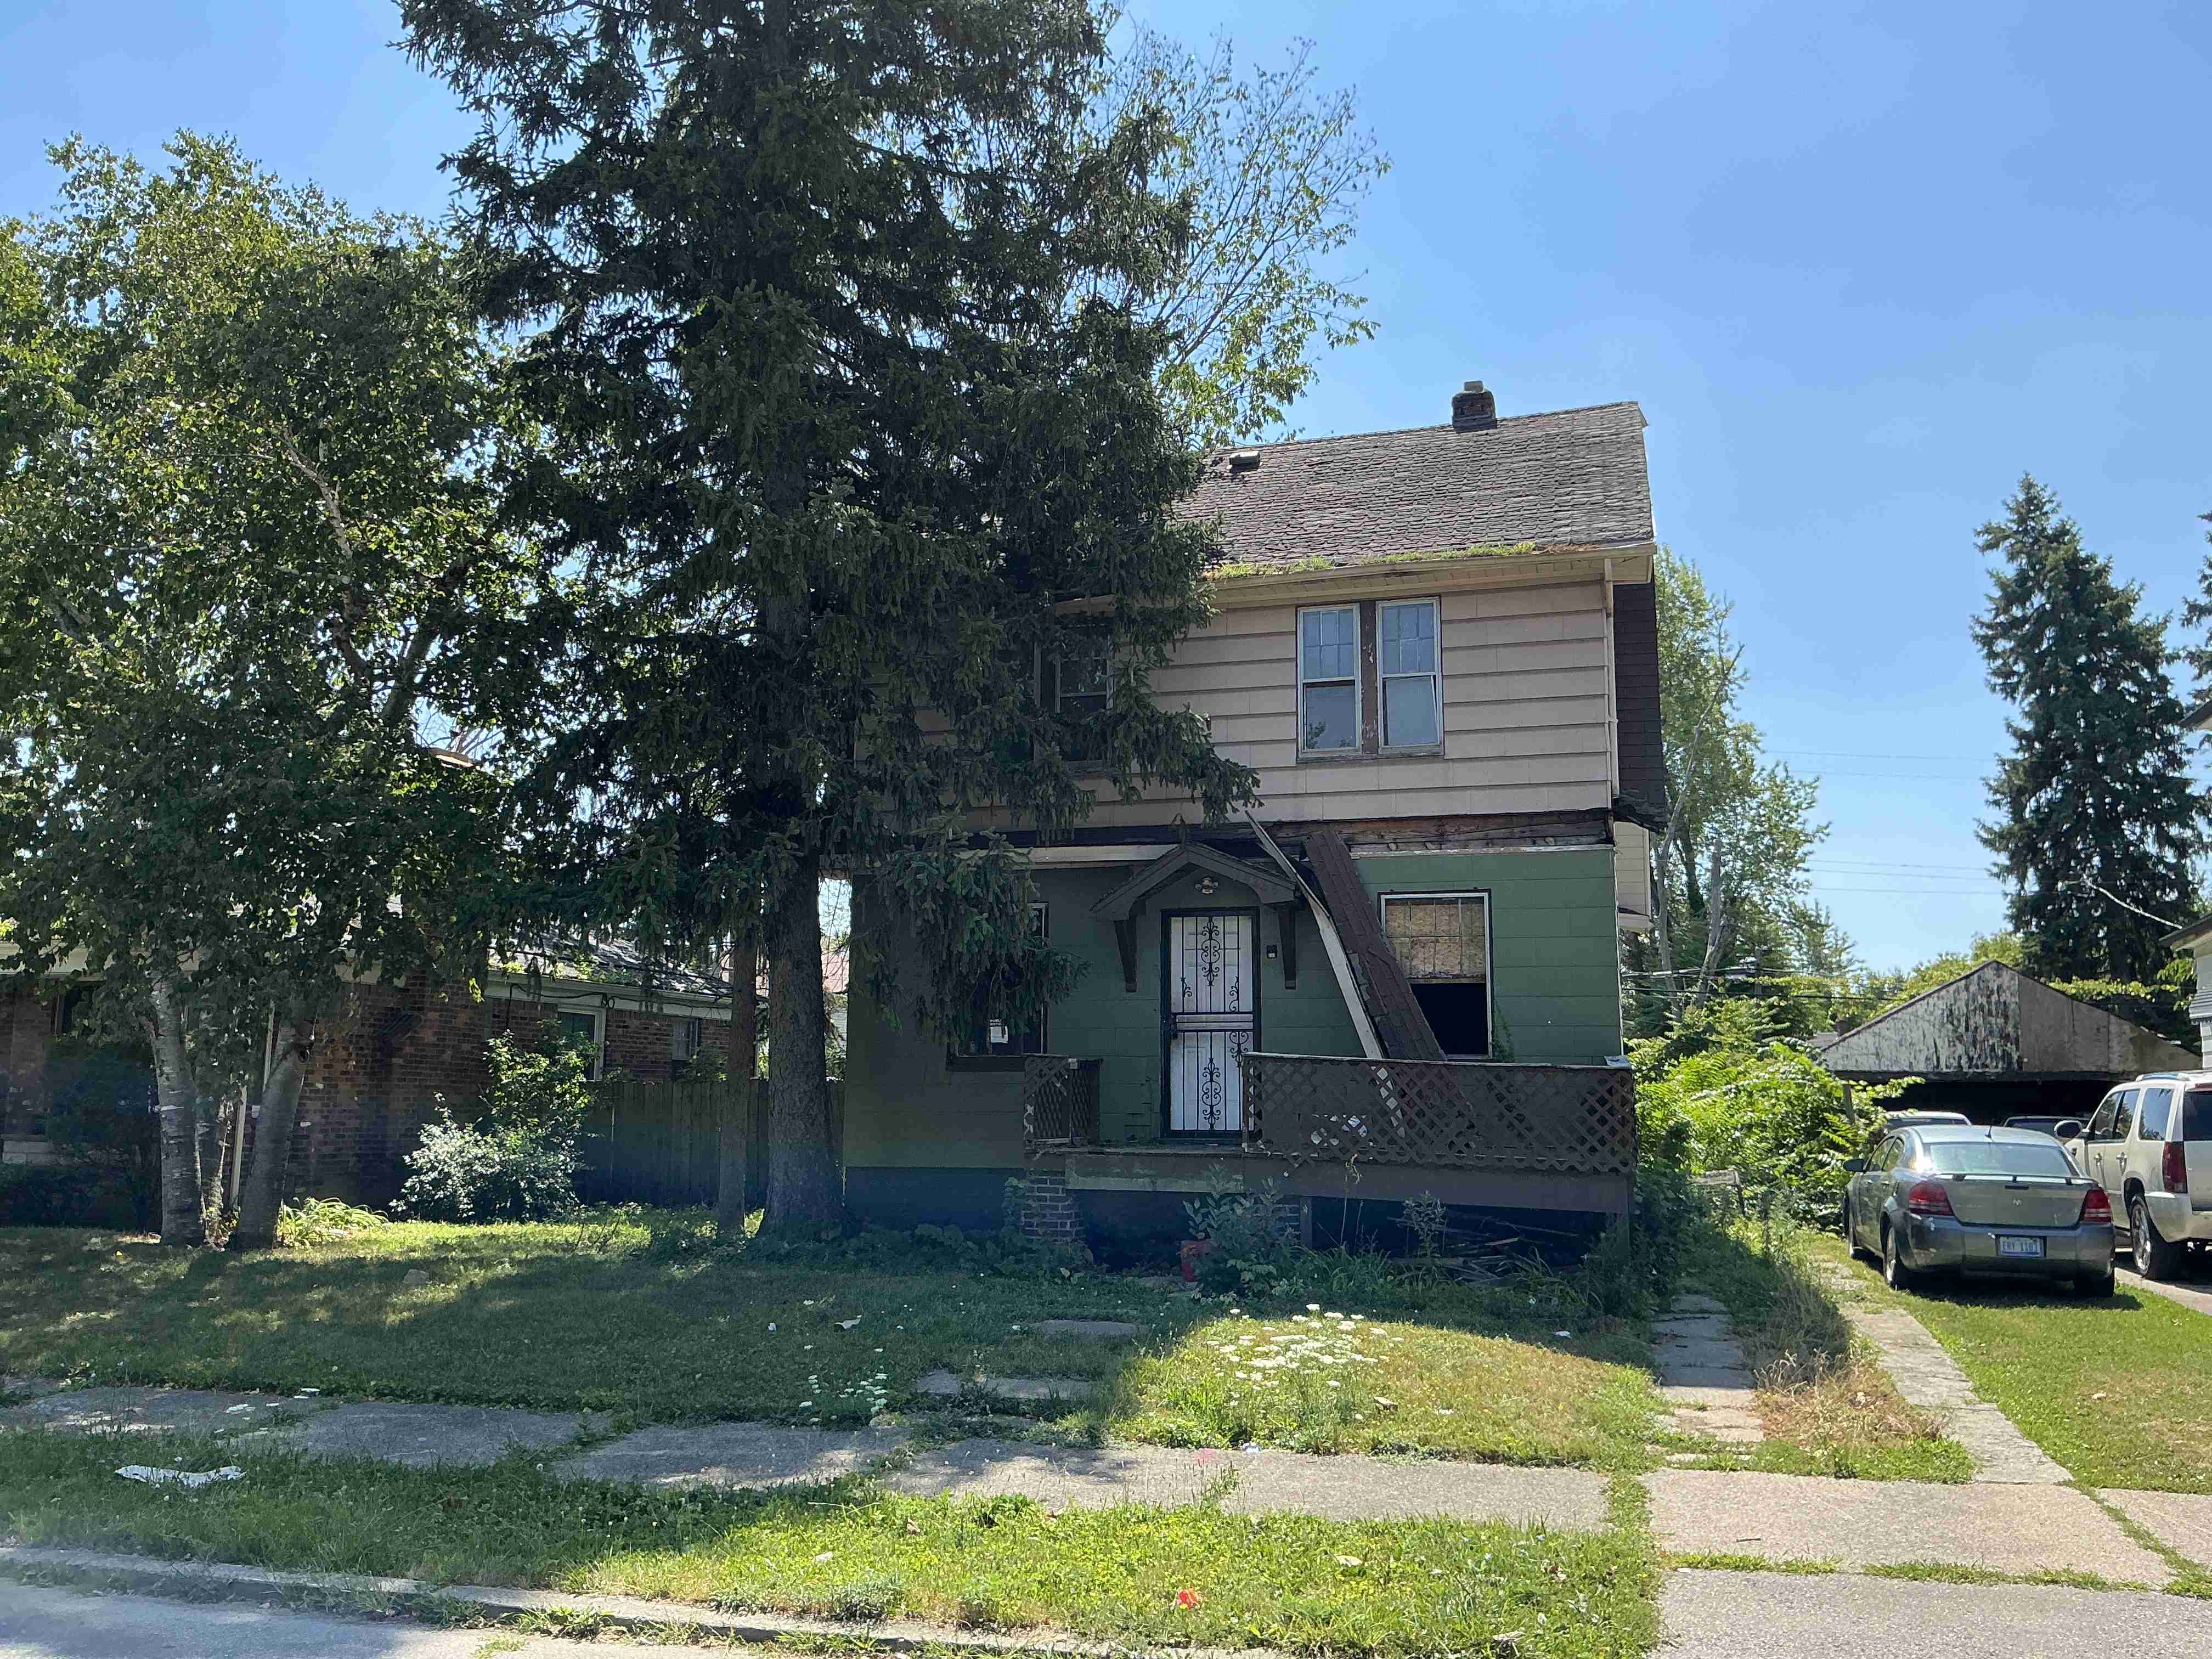
Every night we pull the public inventory of every land bank in America with a trackable feed. This is what that data says in July 2026: 75,358 properties for sale across 51 land banks in 22 states — median asking price $3,360.
No listing site shows this market. Almost none of it reaches Zillow. Here's the shape of America's cheapest real estate, in five numbers.
Restated July 5. This report originally counted 87,475 listings. A photo audit caught one of the largest source feeds (Memphis) publishing thousands of completed sales alongside its live inventory — the land bank's own photos carried SOLD stamps. We purged every affected record across all sources and restated the numbers below. Smaller and true beats bigger and refutable; the pipeline now classifies those statuses automatically. Details on how we keep feeds honest: data & freshness.
1. The headline: 75,358 properties, $3,360 median
Of the 75,358 active listings, 23,474 have posted prices (the rest price at application — normal for land banks). The median posted price is $3,360. For scale, that's under one percent of the median US home price.
The price histogram barely has a right tail:
| Priced at or under | Listings | Share of priced |
|---|---|---|
| $1 | 48 | 0.2% |
| $1,000 | 1,778 | 8% |
| $5,000 | 18,088 | 77% |
| $10,000 | 20,775 | 88% |
Nearly nine in ten priced land bank listings ask $10,000 or less. The cheapest-houses data report explains why this market exists; this report is what it looks like right now — and the live version updates nightly.
2. Five markets hold two-thirds of the inventory
| Market | Listings | Median posted price |
|---|---|---|
| Cleveland Land Bank, OH | 15,576 | $3,213 |
| Genesee County (Flint), MI | 13,975 | mostly priced at application |
| St. Louis LRA, MO | 9,463 | priced at application |
| Chicago city lots, IL | 6,558 | priced at application |
| Pittsburgh Land Bank, PA | 3,012 | $4,041 |
Together: 48,584 listings — 64% of everything we track. (Memphis, formerly the #3 market on paper, fell to 2,099 genuinely for-sale listings after the restatement — most of its published feed was completed sales.) The land bank market is not evenly spread; it concentrates where tax foreclosure concentrated. State by state, Ohio leads with 22,208 listings, then Michigan (19,999), Missouri (12,054), Illinois (8,685), and Tennessee (2,100).
3. The houses: 7,169 structures, median $12,000
Vacant lots dominate, but 7,169 listings are flagged as having a structure — actual buildings. Among the 1,009 of those with posted prices:
- Median asking price: $12,000
- 488 (48%) list under $10,000
- 727 (72%) list under $25,000
(The restatement moved these numbers most: a large share of the "cheap houses" in the original report were Memphis sales that had already closed.) These are the "abandoned houses for sale" people search for — as-is, renovation expected, often with deed conditions. Our abandoned houses guide covers how to evaluate them, and financing a land bank home covers paying for the renovation that follows.
4. The $1 club is real — and conditional
48 listings are priced at $1 or less right now. Louisville's land bank alone posts dozens of side lots at a dollar. As we covered in are $1 houses real?, nominal pricing is a program design, not a fire sale: the buyer usually must own the property next door, maintain the lot, or commit to a plan. Free-and-clear $1 houses for strangers remain a myth; $1 lots for neighbors are policy.
5. Posted prices are the exception, not the rule
Only 31% of listings carry a posted price. The other 69% — including giants like St. Louis LRA, Chicago, Philadelphia, and most of Michigan — price during the application. That's the single biggest difference between shopping land banks and shopping the MLS, and it splits the market into two buyer experiences:
- Sticker markets (Cleveland, Memphis, Kansas City, Baton Rouge): screen by price from your couch, then apply.
- Application markets (St. Louis, Chicago, Birmingham, most of Georgia): pick the parcel, propose, and the program sets the number.
The how-to-buy guide walks the process for both.
Browse the data yourself
Every number above comes from the live inventory on our map — refreshed nightly from official land bank feeds, filterable by price, structure, and program. If you want the next report in your inbox when the data shifts, set a free email alert for your market.
Methodology: counts are active listings aggregated from 51 official land bank sources, restated July 5, 2026 after a source-status audit (see note above). Medians are computed over listings with posted prices only. Structure counts rely on source-provided flags and undercount markets that don't publish building data.
.jpg)